SABAI SABAI FX
Dow Theory Trend Visualizer
Market Structures made simple with multi-timeframe
Many of beginner traders and developing traders struggle
because they do not have eyes to analyze the market structures with multi-timeframe persepectives.Elevate your trading skills mastering MTF analysis and
break the ceiling of break-even traders.
The video above shows some of the features only.
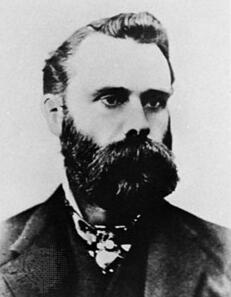
What is dow theory?
Trends made clarified
Dow Theory is the origin of technical analysis which clarified what "Trend market" is, developed by Charles Dow; a founder of The Wall Street Journal and Dow Jones & Company.Dow Theory logically defines when trends start, when trends end and when trends reverse using highs and lows which is the foundation to identify market structures.Dow discovered these principles, analyzing mainly stock market activities and it is still widely used in various asset markets as technical analysis methodology.
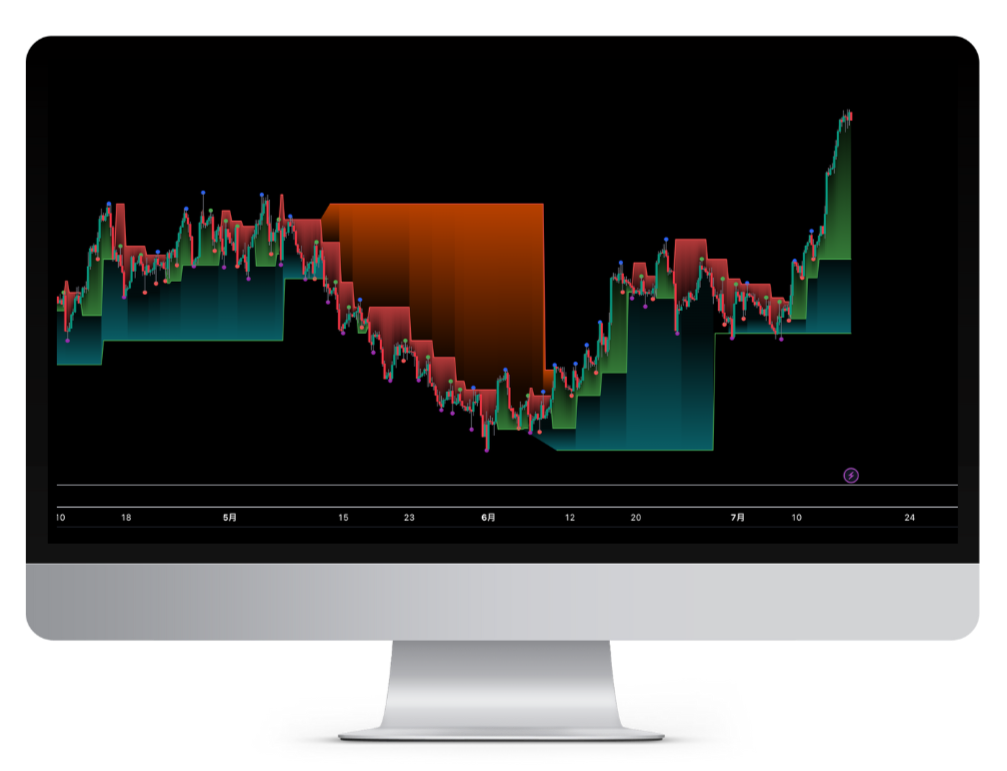
next-gen visualization of
MTF Trend Directions
This indicator displays trend directions in multi-timeframes based on Dow Theory utilizing the latest visualization technologies.It is designed to help traders/investors identify market structures with multi-timeframe analysis skills.

What is AIKIDO?
Aikido [aikiꜜdoː] is a modern Japanese martial art and self-defense system that redirects the opponent's attack strength and momentum. By using attackers' force against themselves and involving off-balance, opponents fall or are thrown by their own power.
Utilizing Upper timeframe Momentum
AIKIDO Trading is the trading concept invented by SABAI SABAI FX while teaching chart reading skills to its students.
It is characterized by the fact that lower timeframe is always influenced by upper timeframe, therefore taking a position which aligns with upper timeframe's trend direction enables traders to obtain help from the market just like AIKIDO.But how does this indicator enable that?
master trend following
and
reversal trading
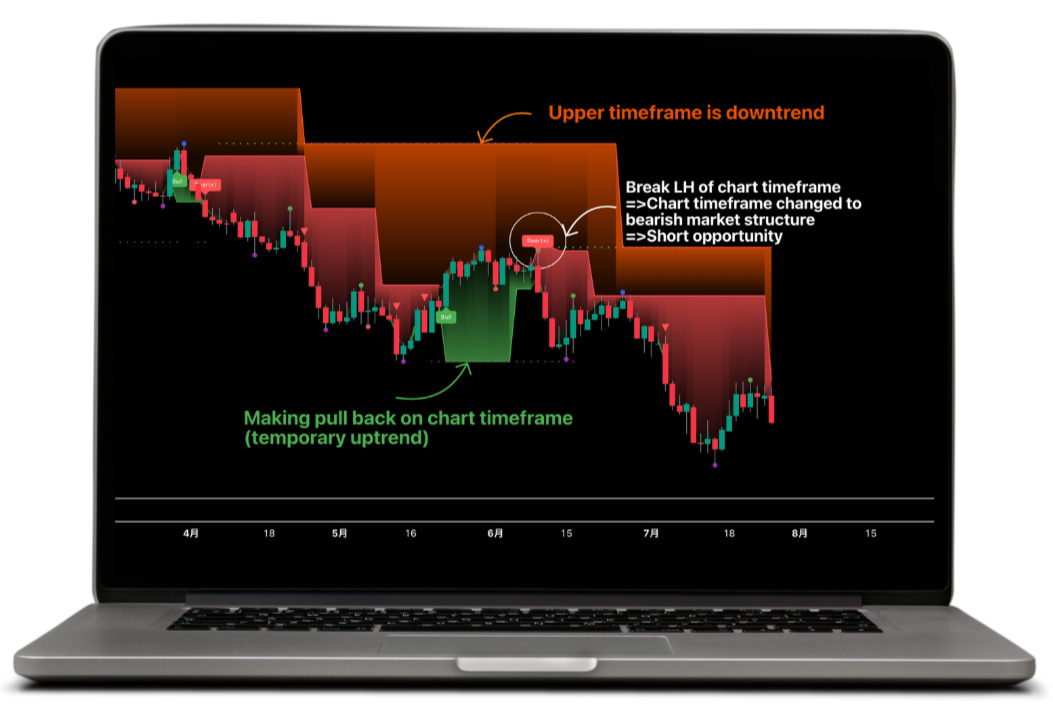
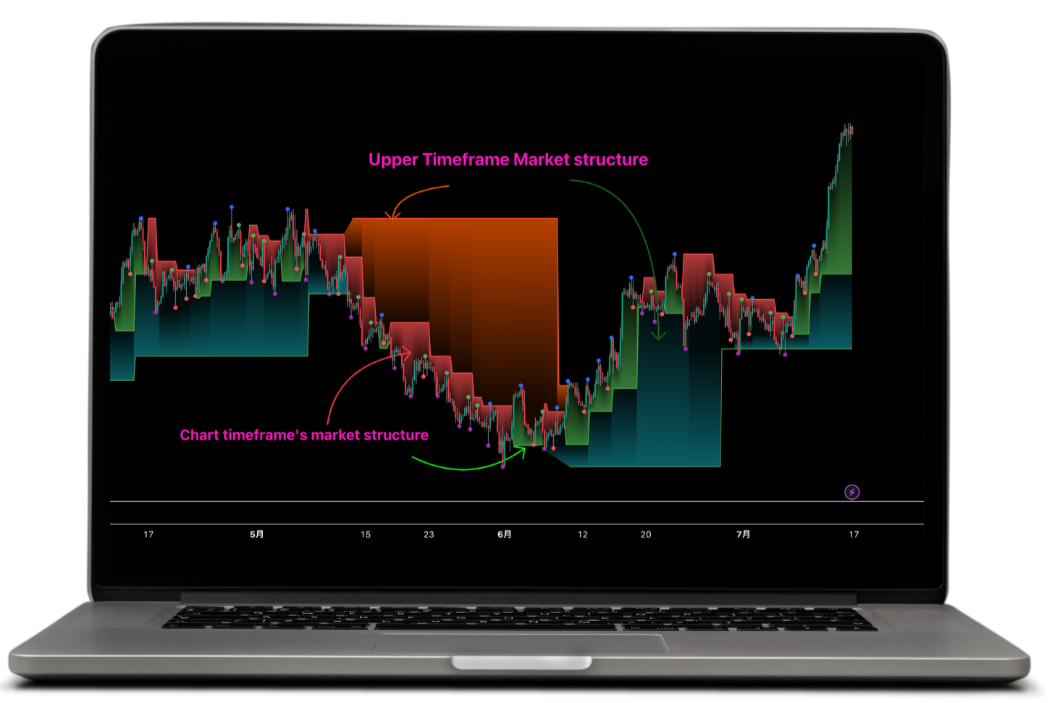
The indicator displays signals when trends change so that you catch opportunities for trend trading and reversal trading with alert setting options.The left chart illustrates an example of signals where a trend reversal in the chart timeframe and trend continuation in the upper timeframe happen.This is exactly when traders can take a position aligning with an upper timeframe ; AIKIDO
Signals available:1. Bull(+)/Bear(+) :
When the chart timeframe's trend and the upper timeframe's trend has got the same direction
2. Bull/Bear:
When the chart timeframe's trend changes
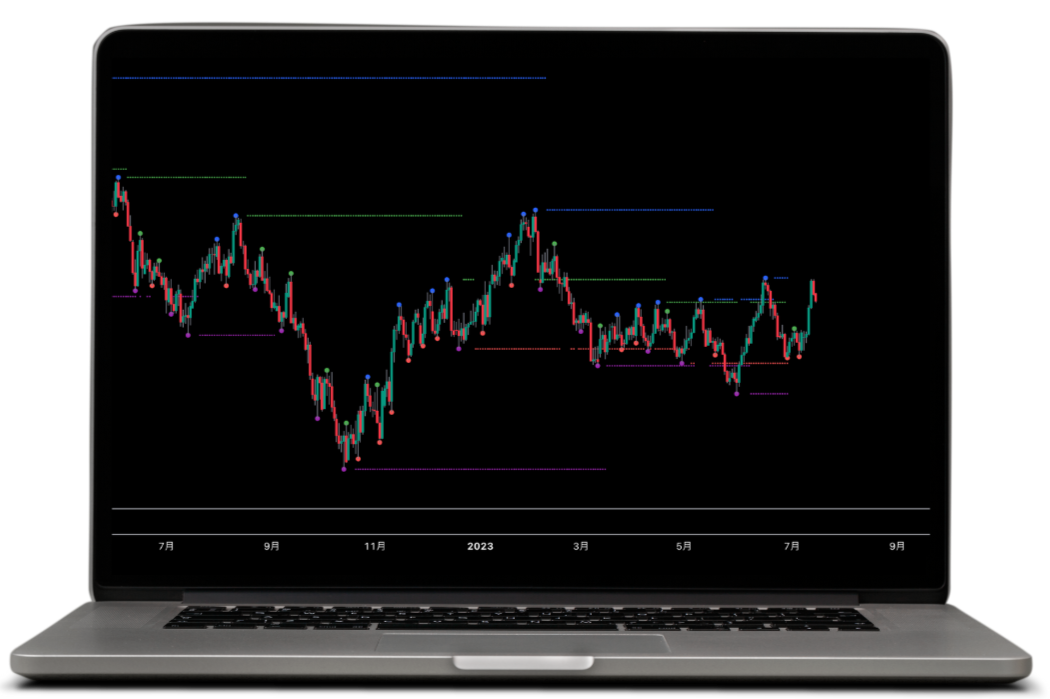
MTF HH/LH/HL/LL
Higher timeframe is always a key to develop your trading plans with understanding of the current market structures.The indicator displays Higher High/Lower High/Higher Low/Lower Low of an upper timeframe so that traders will not miss upper timeframes' market structures.
Also, these key levels can be considered liquidity and dominant support & resistance zones.
Trading in the higher timeframe direction is one of the Key success facotors in technical trading
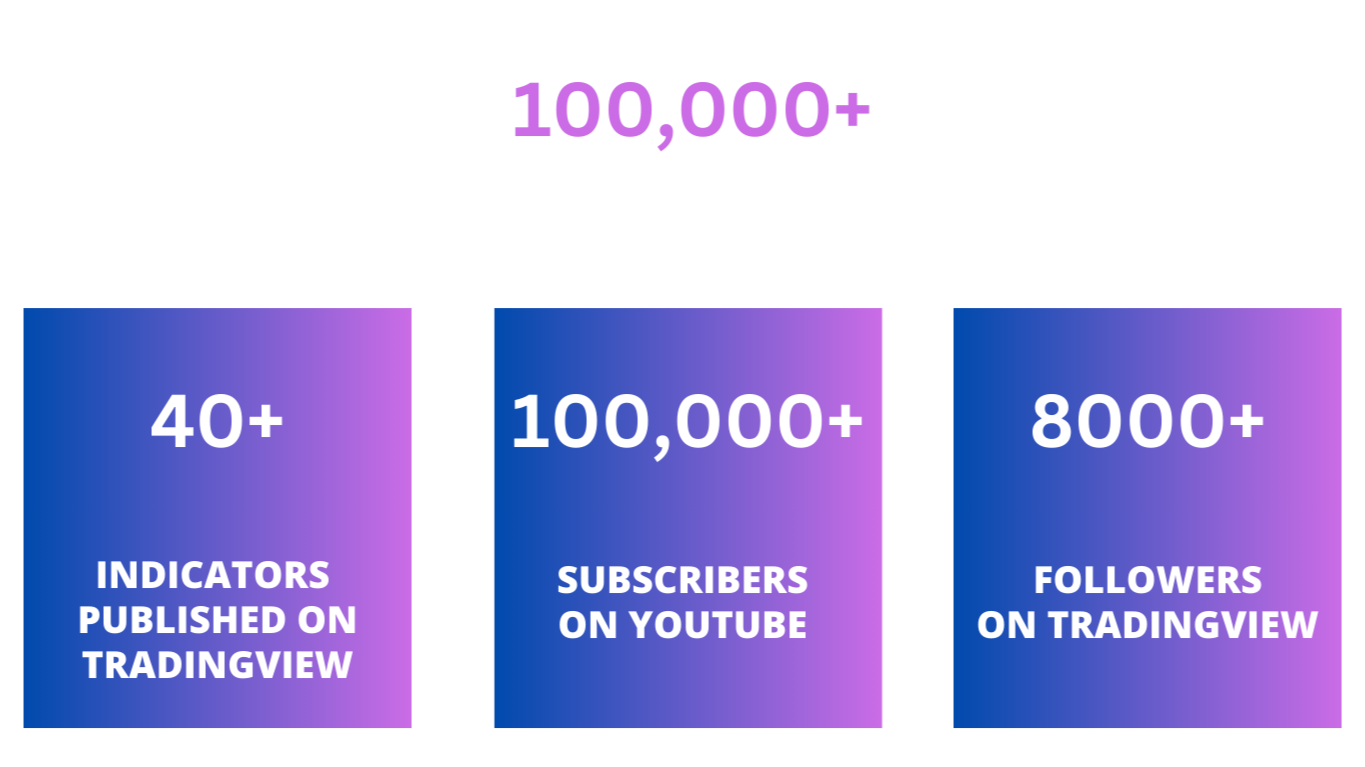
Why Choose US
Pricing
39 USD
110 USD
(SAVE 5%)
350 USD
(SAVE25%)
Copyright©︎SABAI SABAI FX All Rights Reserved
HIGH RISK WARNING: Foreign exchange trading carries a high level of risk that may not be suitable for all investors. Leverage creates additional risk and loss exposure. Before you decide to trade foreign exchange, carefully consider your investment objectives, experience level, and risk tolerance. You could lose some or all of your initial investment; do not invest money that you cannot afford to lose. Educate yourself on the risks associated with foreign exchange trading, and seek advice from an independent financial or tax advisor if you have any questions.